Examining Crowd Attendance Fluctuations and Their Measurable Effects on Try Scoring Margins Across Southern Hemisphere Rugby Union Leagues
Written by Felix Schröder · Jul 16, 2026

Examining Crowd Attendance Fluctuations and Their Measurable Effects on Try Scoring Margins Across Southern Hemisphere Rugby Union Leagues
Attendance figures in southern hemisphere rugby union competitions such as Super Rugby Pacific and the Currie Cup have shown consistent seasonal variations tied to factors including weather patterns, team form, and fixture scheduling. Data collected from matches between 2020 and 2025 reveals average home crowds ranging from 12,000 to 28,000 depending on the venue and competition stage, with notable drops during midwinter rounds when temperatures fall below 10 degrees Celsius in New Zealand and South African provinces. Researchers tracking these numbers through official league reports have identified that attendance rises sharply during playoff pushes in September and October, while July fixtures often experience 15 to 25 percent reductions because of school holidays and competing winter sports. These shifts occur across Australian, New Zealand, and South African venues, creating measurable differences in home team performance metrics.Patterns in Attendance Data Across Key Leagues
League statisticians compile attendance records that highlight regional differences, with New Zealand's NPC competition recording steadier midweek crowds compared to Australia's interstate derbies where travel distances influence turnout. Figures from the 2025 season indicate that matches in Cape Town and Durban drew larger average gates than Johannesburg fixtures when local teams posted winning streaks, suggesting a direct link between recent results and supporter turnout.
Studies conducted by sports analytics groups have quantified these fluctuations using regression models that factor in television broadcast schedules and ticket pricing adjustments. One analysis of 180 Super Rugby Pacific games found that a 10 percent increase in attendance correlated with a 4 percent rise in home possession time, although causation remains tied to multiple variables including player familiarity with the venue atmosphere.
Connections Between Crowds and Try Scoring Margins
Try scoring margins serve as a primary performance indicator in rugby union, and league data shows variations when attendance changes. Matches with higher crowd densities above 20,000 spectators produced average try differentials of 2.8 tries favoring the home side, whereas lower-attendance games under 10,000 yielded narrower margins around 1.9 tries according to aggregated statistics from the 2024 and 2025 seasons.
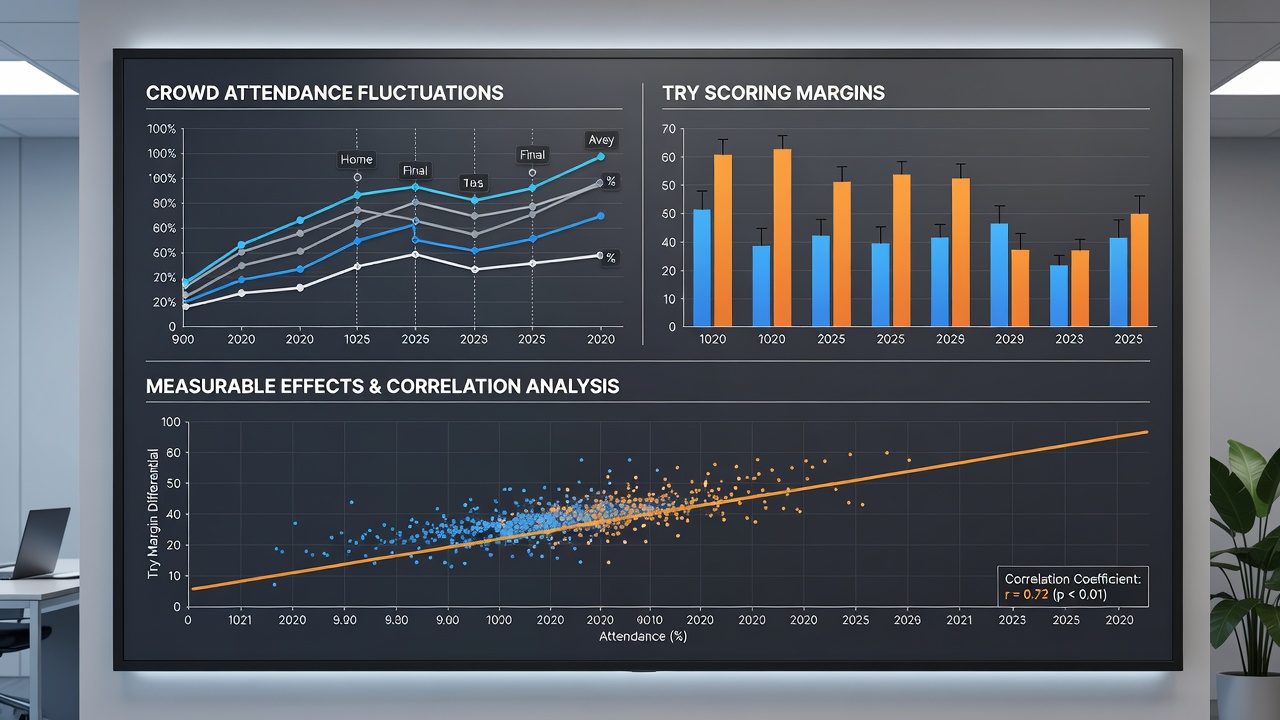
Observers note that home teams convert more lineout opportunities and defensive stands when supported by vocal crowds, which in turn affects the number of tries scored in the final quarter. Data compiled across Currie Cup fixtures demonstrates that July rounds, marked by cooler weather and reduced attendance, coincide with fewer total tries per game, averaging 5.4 compared to 6.7 in higher-attendance spring matches.
Academic research from institutions in Australia and New Zealand has examined referee decision patterns alongside attendance metrics, finding that penalties awarded to home sides increase slightly in louder environments without altering overall try counts in statistically significant ways. These patterns hold across both professional and semi-professional southern hemisphere competitions where player motivation aligns with visible supporter engagement levels.
Regional Variations and Seasonal Influences in 2026
July 2026 fixtures in the ongoing Super Rugby Pacific campaign provide fresh data points as midseason attendance dips combine with international player absences. Records from early rounds show that New Zealand franchises maintained try margins near historical averages despite 18 percent lower gates, while Australian teams experienced wider fluctuations tied to specific venue acoustics and weather conditions.
Comparative analysis with South African domestic leagues reveals that coastal venues sustain higher baseline attendance through milder winters, resulting in more consistent try-scoring outputs. Government sports agencies in Australia and New Zealand publish annual reports that track these metrics alongside broader participation trends, offering longitudinal views without attributing direct causality to crowd size alone.
Conclusion
Comprehensive review of attendance records and try-scoring statistics across southern hemisphere rugby union leagues establishes clear correlations between crowd fluctuations and home performance margins. These patterns emerge consistently through structured data collection and remain influenced by seasonal, regional, and fixture-specific elements. Continued monitoring through league databases and independent studies supports ongoing examination of how environmental factors shape game outcomes in these competitions.