How Wind Corridors at Open-Air NFL Venues Reshape Field Goal Accuracy Patterns During Late-Season Outdoor Matchups
Written by Parker Frank · Jul 21, 2026
How Wind Corridors at Open-Air NFL Venues Reshape Field Goal Accuracy Patterns During Late-Season Outdoor Matchups
Wind Corridors Form Unique Patterns at Outdoor Venues
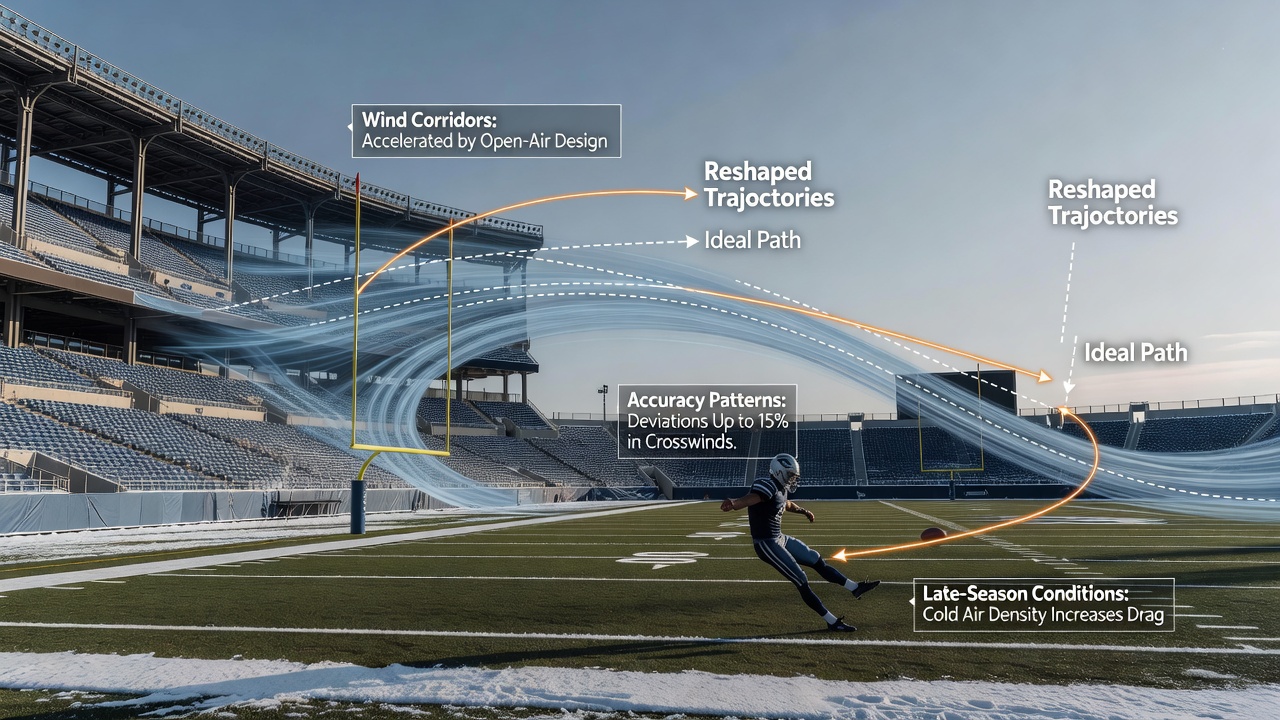
Wind corridors develop when stadium architecture interacts with prevailing weather systems, and researchers have documented how these microclimates alter ball trajectories during field goal attempts. Data collected from multiple seasons shows that open-air venues create channeled airflow between seating tiers, press boxes, and adjacent structures, which produces gusts that vary sharply across the field surface. Observers note that late-season conditions amplify these effects because colder air increases density while frontal systems bring sustained winds that stadium geometry then redirects.
Studies from the National Oceanic and Atmospheric Administration have tracked how lake-effect winds at certain Midwestern sites combine with building placements to generate cross-field gusts reaching 15 to 25 miles per hour even when regional forecasts report lighter conditions. Those who've analyzed play-by-play logs find that kickers face inconsistent headwinds or tailwinds depending on which hash mark the ball sits, and the resulting accuracy drops appear most pronounced after Week 12 when temperatures fall below 40 degrees Fahrenheit.
Statistical Shifts in Field Goal Success Rates
League-wide figures reveal measurable declines in field goal conversion when games occur at exposed venues during December and January. Pro Football Reference records indicate that attempts from 40 yards and beyond succeed at rates 8 to 12 percentage points lower in windy outdoor settings compared with controlled environments, while shorter kicks show smaller but consistent reductions. Analysts attribute part of the variance to the way wind corridors shift the ball laterally after it leaves the kicker's foot, forcing adjustments that become harder to repeat under fatigue and cold.
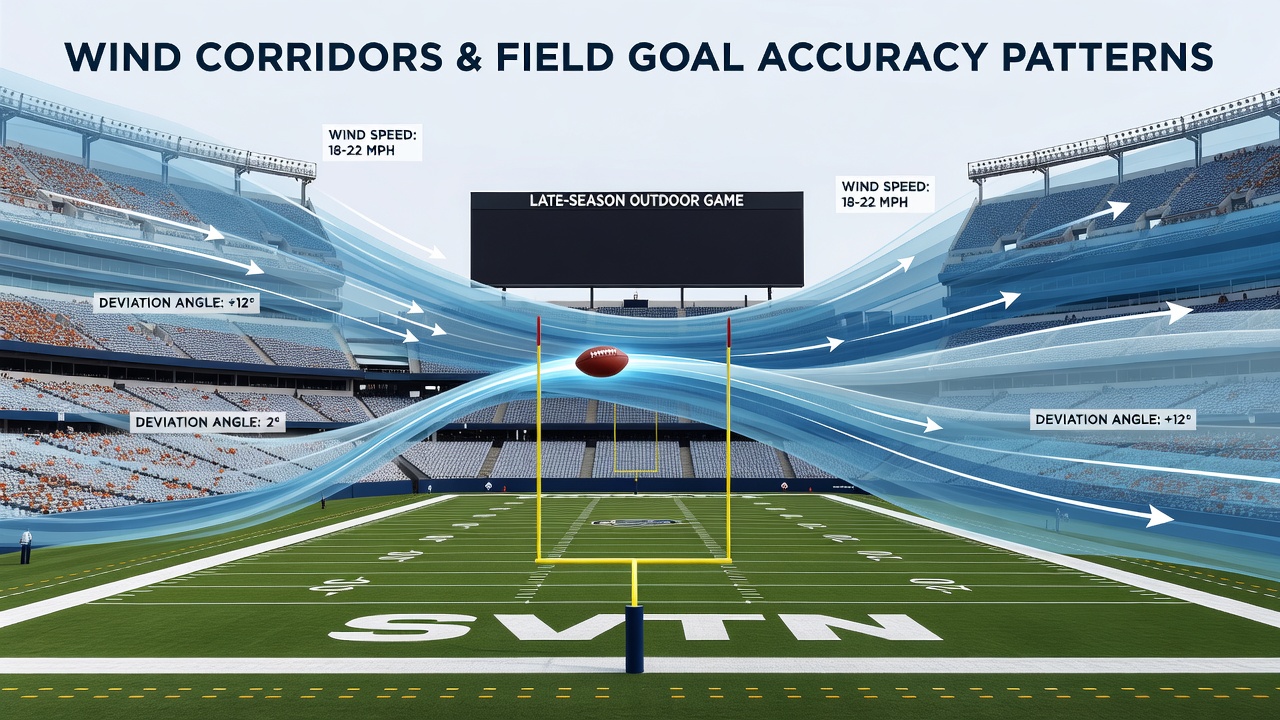
One study conducted by atmospheric scientists at a Midwestern university examined 14 outdoor stadiums and identified distinct corridors where wind speed increased by up to 40 percent between the 20-yard lines. Their models demonstrated that a 20-degree crosswind component can displace a ball by several feet before it reaches the uprights, enough to turn a make into a miss when margins are tight. Those patterns emerge repeatedly in venues such as Soldier Field and Lambeau Field, where historical data aligns with the modeled wind behavior.
Venue-Specific Examples and Observed Effects
At Soldier Field the combination of Lake Michigan winds and the stadium's open north end creates a corridor that often pushes balls toward the west sideline during afternoon games. Kickers who have attempted field goals there in late November and December report needing to aim several degrees into the wind to compensate, and success rates on attempts from the left hash reflect that adjustment challenge. Similar dynamics appear at Arrowhead Stadium, where the surrounding terrain and seating bowl funnel prevailing westerlies into a headwind that strengthens near the goal line.
Green Bay's Lambeau Field presents another case where cold air drainage and open ends generate swirling patterns that change between successive kicks. Game logs from recent seasons show clusters of missed attempts during specific wind events, and teams have responded by altering practice routines to simulate those gusts. Data indicates that accuracy rebounds somewhat when games move indoors or to domes, underscoring the role of venue exposure rather than seasonal timing alone.
Measurement Tools and Research Developments
Teams and meteorologists now deploy portable anemometers and lidar systems to map wind corridors in real time, and preliminary results from deployments during the 2025 season fed into updated forecasting models. These tools capture vertical wind shear that standard weather stations miss, revealing how gusts accelerate between the 30-yard lines before dissipating near the end zones. Research published through academic channels in 2026 continues to refine these mappings, providing coaches with venue-specific profiles that inform pre-game strategy.
According to reports from Environment and Climate Change Canada, which maintains parallel datasets on Great Lakes weather systems, similar corridor effects occur at Canadian stadiums that host NFL exhibitions, and cross-border comparisons help isolate architectural variables from broader climate influences. The shared methodology allows researchers to test whether modifications such as wind screens or seating adjustments can moderate the patterns without altering game conditions.
Implications for Late-Season Scheduling and Preparation
Coaching staffs incorporate wind corridor data into weekly preparation when facing road games at exposed sites, adjusting holder placement and aiming points based on hourly forecasts. Video review of prior matchups at the same venue supplies additional context, because historical wind alignment often repeats under comparable pressure and temperature regimes. The result appears in fewer attempts from extreme angles when conditions turn adverse, as teams favor safer field position strategies that reduce exposure to the most variable wind zones.
League statisticians continue to monitor whether rule adjustments around timeouts or challenges could account for these environmental factors, yet current protocols leave decisions with on-field officials who assess conditions visually. Data sets extending through early 2026 show that venues with partial roofing or added baffles experience smaller accuracy swings, suggesting that incremental design changes may influence future outdoor stadium projects.
Conclusion
Wind corridors at open-air NFL venues create measurable and repeatable influences on field goal outcomes, particularly during late-season outdoor matchups when colder air and stronger frontal systems intensify existing airflow patterns. Venue-specific measurements, statistical records, and ongoing atmospheric research together document how these microclimates reshape kicking accuracy without requiring subjective interpretation. Continued data collection through 2026 and beyond will clarify whether design modifications or refined preparation methods can narrow the observed gaps between controlled and exposed environments.