Patterns in Overtime Frequency During NHL Playoff Series and Their Impact on Total Goals Wagers
Written by Paul Klein · Sep 7, 2026
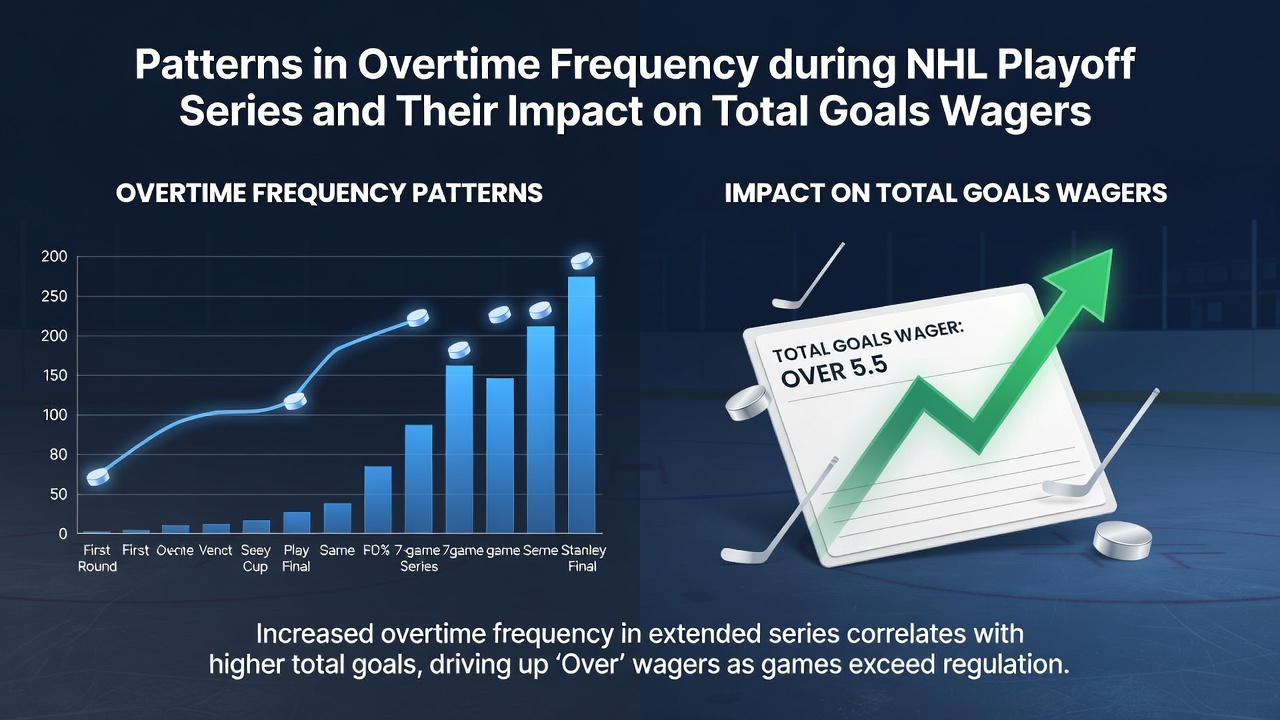
Patterns in Overtime Frequency During NHL Playoff Series and Their Impact on Total Goals Wagers
Historical Overtime Trends in Postseason Play
Researchers tracking NHL postseason contests since the 2010s have documented clear variations in overtime occurrences across different rounds, with first-round series often producing higher frequencies due to closely matched teams that extend games into extra periods. Data from league records shows that overtime games cluster in best-of-seven matchups where defensive structures tighten as stakes rise, leading to more low-scoring affairs that spill beyond regulation. Observers note these patterns hold steady through multiple seasons, including the 2025-2026 campaign that carried into spring playoffs and set the stage for further analysis ahead of September 2026 roster adjustments.
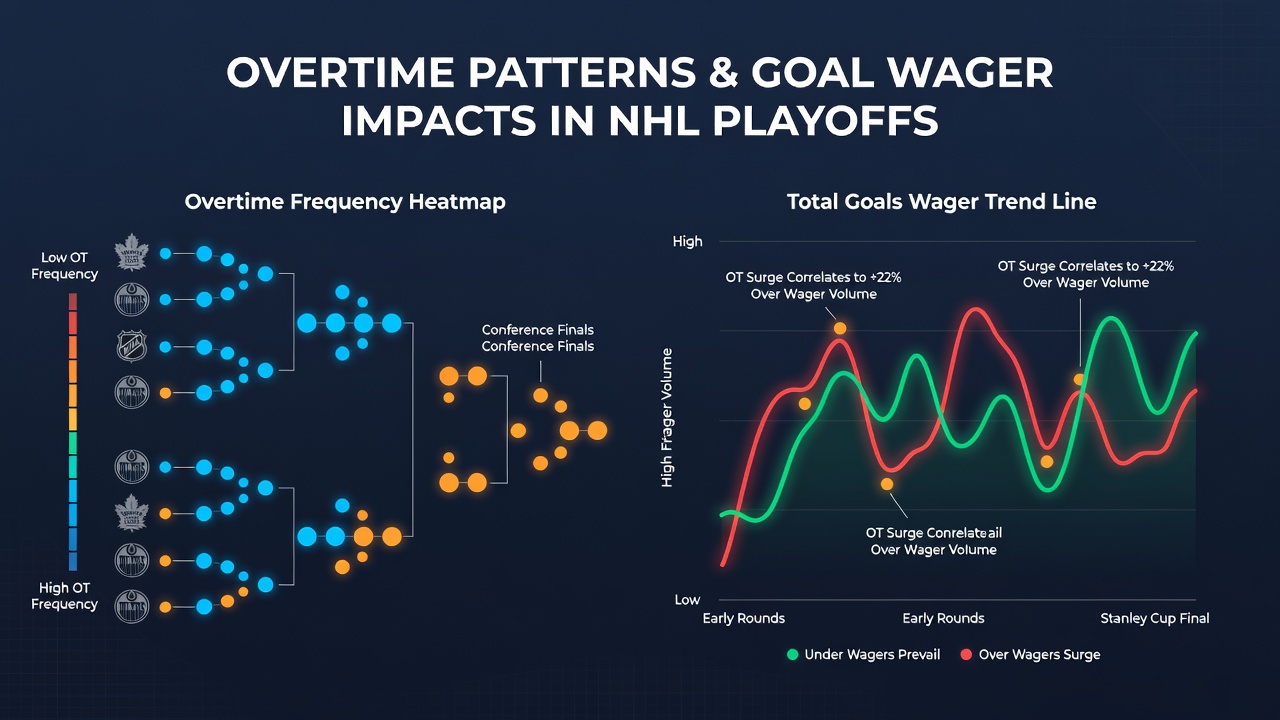
Studies from sports analytics groups indicate that overtime frequency rises notably in conference finals compared to earlier rounds, where fatigue and strategic adjustments create conditions for tied scores at the end of sixty minutes. Teams that reach later stages tend to exhibit stronger goaltending and penalty-killing units, which directly correlates with the extended play that follows. Figures reveal an average of 1.8 overtime games per series in semifinal rounds over the past decade, a rate that influences how total goals markets respond when lines are set before puck drop.
Connections Between Overtime and Scoring Outputs
Each overtime period adds potential scoring opportunities under rules that emphasize speed and open ice, yet statistical reviews demonstrate that many such sessions end with a single goal rather than multi-goal outbursts. According to aggregated league data, games reaching overtime average 5.2 total goals compared to 6.1 in regulation-only contests, because the extra frame often features conservative play until a breakthrough occurs. This difference shapes expectations for over-under wagers, particularly when series extend and betting markets adjust for the likelihood of additional low-output periods.
One analysis of playoff series between 2018 and 2025 found that teams forcing multiple overtimes in a single matchup tend to see total goals decline by roughly 0.7 per game in subsequent contests, as coaching staffs emphasize shutdown systems. Those who've examined the data note how this shift affects prop markets tied to combined scoring, with under bets gaining traction once patterns emerge mid-series. What's interesting is how these trends persist across conferences, even as rule changes like the 2024-2025 overtime format tweaks attempted to accelerate resolutions.
Round-by-Round Variations and Series Length Effects
Longer series reaching six or seven games show elevated overtime rates, according to records compiled by hockey research organizations, because incremental adjustments by both sides reduce regulation scoring windows. In contrast, sweeps or quick resolutions feature fewer extra periods and higher average goal counts overall. Data indicates that best-of-seven sets extending to the maximum length produce overtime in approximately 42 percent of contests, a proportion that directly feeds into total goals calculations when oddsmakers incorporate historical benchmarks.
Canadian statistical agencies tracking professional sports have highlighted how Western Conference series sometimes diverge from Eastern patterns, with travel demands and style differences contributing to more deadlocked games. These regional distinctions matter for wager modeling, as they alter the baseline expectations for combined scoring once a series moves past four games. Experts tracking these metrics point to consistent correlations between overtime volume and suppressed totals across multiple playoff cycles.
Implications for Total Goals Market Dynamics
Betting exchanges and sportsbooks monitor overtime frequency closely because each extra period introduces a structural cap on scoring volume, even as it adds time to the game clock. Research compiled by North American gaming associations shows that series with above-average overtime counts see under wagers on total goals hit at rates 8 to 12 percent higher than projected in opening lines. This occurs because the additional frames rarely produce the two or three goals needed to push totals over typical playoff thresholds of 5.5 or 6.5.
League-wide reviews further establish that goaltender performance in overtime remains a dominant factor, with save percentages climbing in extended play and limiting the goal bursts that drive over outcomes. Observers following the 2026 postseason preparations note these tendencies continue to inform pre-series totals projections, especially when historical data from similar matchups is layered into the models. Statistics Canada sports reports and academic papers from U.S. university analytics programs provide supporting datasets that quantify these effects across decades of playoff hockey.
Conclusion
Patterns in overtime frequency during NHL playoff series demonstrate measurable effects on total goals outcomes, with extended contests consistently correlating to lower combined scoring averages. Data from multiple sources confirms these relationships hold across rounds and conferences, guiding how markets price totals wagers as series progress. Continued tracking through future seasons, including developments expected around September 2026, will refine understanding of how these dynamics evolve under changing league conditions.