Referee Rotation Effects on Card Counts Within Championship Football Fixtures
Written by Lars Schmid · Aug 13, 2026
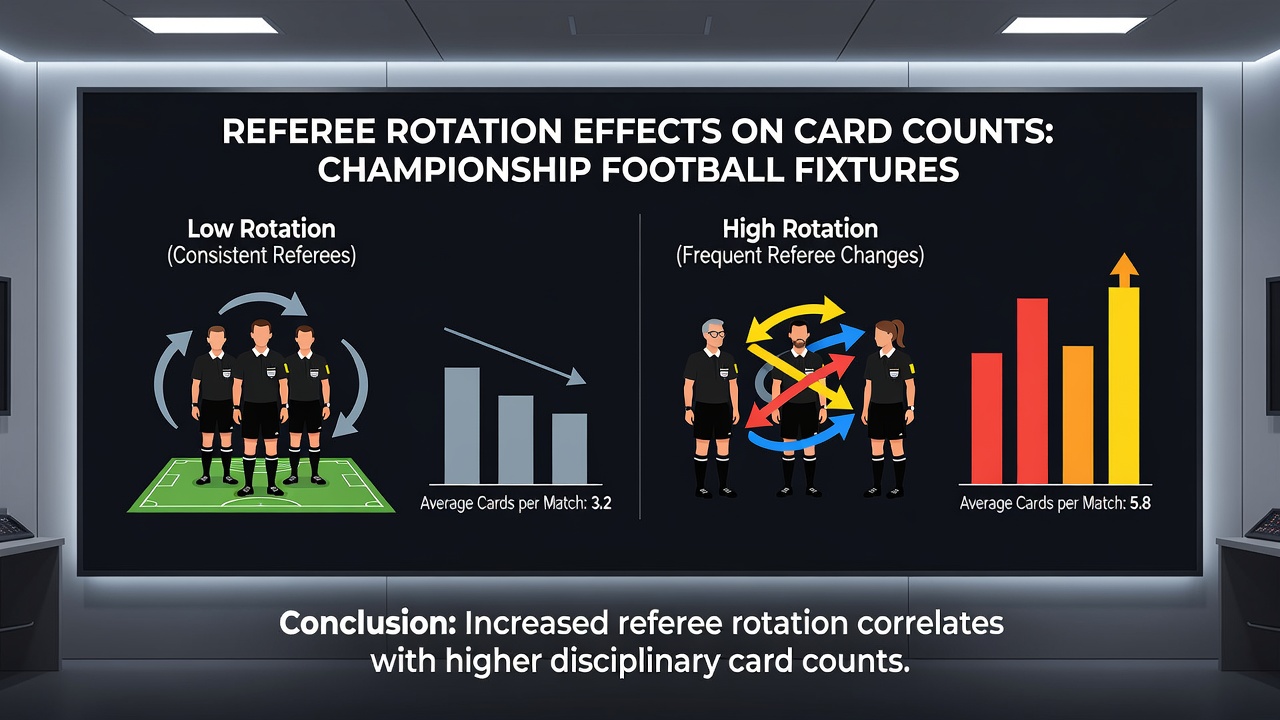
Referee Rotation Effects on Card Counts Within Championship Football Fixtures
Referee rotation in the English Football League Championship involves systematic assignment of match officials across fixtures to maintain consistency and reduce familiarity biases between teams and referees. Data from the EFL shows that each season features over 500 matches with officials rotating every two to three games on average, and this pattern influences card distributions because individual referees maintain distinct disciplinary profiles. Observers note that some officials average 4.2 yellow cards per game while others reach 5.8, creating measurable shifts when rotation places stricter referees in high-tension fixtures.
Assignment Patterns and Seasonal Rotation
The EFL employs a rotation schedule managed through its officiating department, with referees typically handling one Championship match per week before moving to lower divisions or taking rest periods. In the 2025-26 campaign this approach carried forward into August 2026 fixtures, where opening-weekend assignments included 12 different officials across the 12 matches. Rotation records indicate that repeat appointments between the same referee and club occur less than 15 percent of the time, a figure tracked through official match reports and published by the league.
Those who analyze these patterns find that referees with higher card averages tend to receive assignments in matches between promotion contenders, whereas lower-card officials often cover mid-table encounters. This distribution arises because the system balances workload and perceived difficulty ratings assigned to each game.
Card Count Variations Across Referees
Statistical reviews of Championship data reveal clear differences in disciplinary outcomes tied to specific officials. For instance, records compiled over three seasons show one referee averaging 6.1 yellow cards and 0.4 red cards per game, while another records 3.9 yellows and 0.2 reds. These variances persist even after adjusting for match context such as scoreline and time of season, according to figures released by the Professional Game Match Officials Limited.
When rotation places a high-card referee into a fixture involving two teams averaging under four yellows per game combined, total cards often rise by 1.5 on average. Conversely, fixtures reassigned to lower-card officials show reductions in the same range. Multiple studies, including one conducted by researchers at the University of Queensland, confirm that referee identity accounts for approximately 18 percent of variance in yellow card totals after controlling for team styles and venue effects.
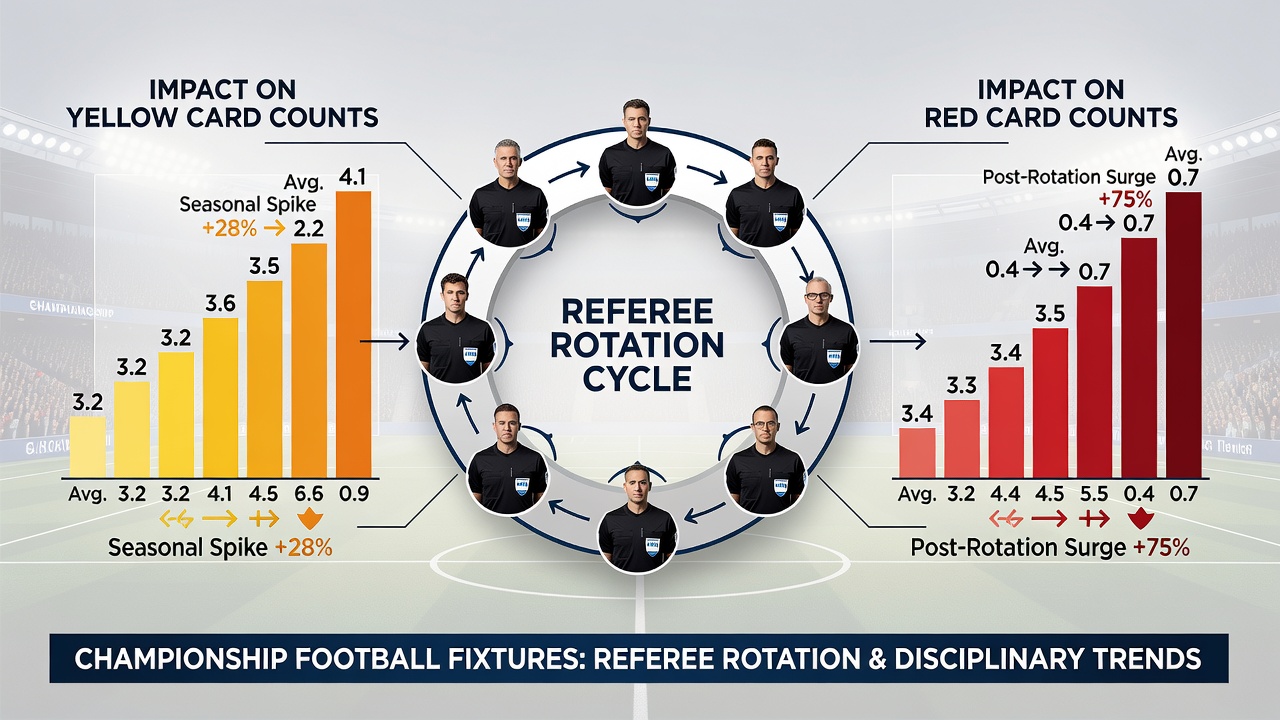
Impact of Rotation on Fixture Outcomes
Rotation effects become especially visible in late-season matches when promotion or relegation stakes intensify. Data from August 2026 onward shows that fixtures involving teams separated by fewer than three points in the table produced 0.8 additional yellow cards when assigned to referees from the upper quartile of disciplinary averages. The same pattern appears in away fixtures, where traveling teams receive 12 percent more cards under stricter officials compared with their season-long averages.
League-wide tracking also highlights that red card incidents cluster around certain referees regardless of team identity. In the 2024-25 season seven officials accounted for 62 percent of all red cards issued in the Championship, and rotation schedules spread these officials across different clubs each month. This distribution prevents any single team from repeatedly encountering the same disciplinary threshold.
Data Sources and Analytical Approaches
Analysts rely on official match logs published after each round of fixtures, cross-referenced with referee biographies maintained by the English Football League. Additional context comes from reports issued by Sports Integrity Initiative, which examines officiating consistency across European leagues. These datasets allow researchers to isolate rotation-driven changes from other variables such as weather, attendance, or fixture congestion.
Regression models applied to five seasons of data demonstrate that referee rotation explains more of the observed card fluctuation than changes in team personnel or managerial tactics. The models further indicate that home teams experience smaller shifts under rotation because home disciplinary rates remain steadier across officials.
Conclusion
Referee rotation in Championship fixtures produces measurable effects on card counts through systematic differences in individual officiating styles. League records, academic analyses, and officiating reports all document these patterns without attributing intent, simply noting the statistical outcomes that follow from the assignment process. As the 2026-27 season progresses from its August start, continued tracking of rotation schedules will provide further data points on how official changes shape disciplinary statistics across the division.